Fuse is a Microsoft Partner, based in Northampton. We help organisations of all sizes to maximise IT efficiencies through the use of Microsoft cloud computing solutions.
Unlocking Business Insights with Power BI
A game-changer for companies of all sizes
As data becomes increasingly central to business decision-making, companies are seeking tools that are both powerful and accessible. Microsoft Power BI stands out as a leading solution, offering intuitive dashboards, seamless integration with Microsoft services, and scalable analytics capabilities.
Why Power BI?
Power BI empowers businesses to:
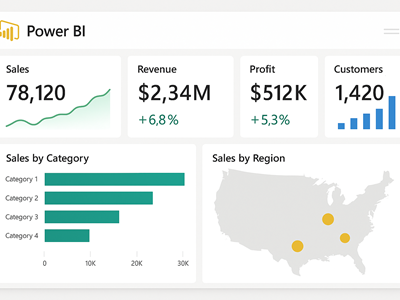
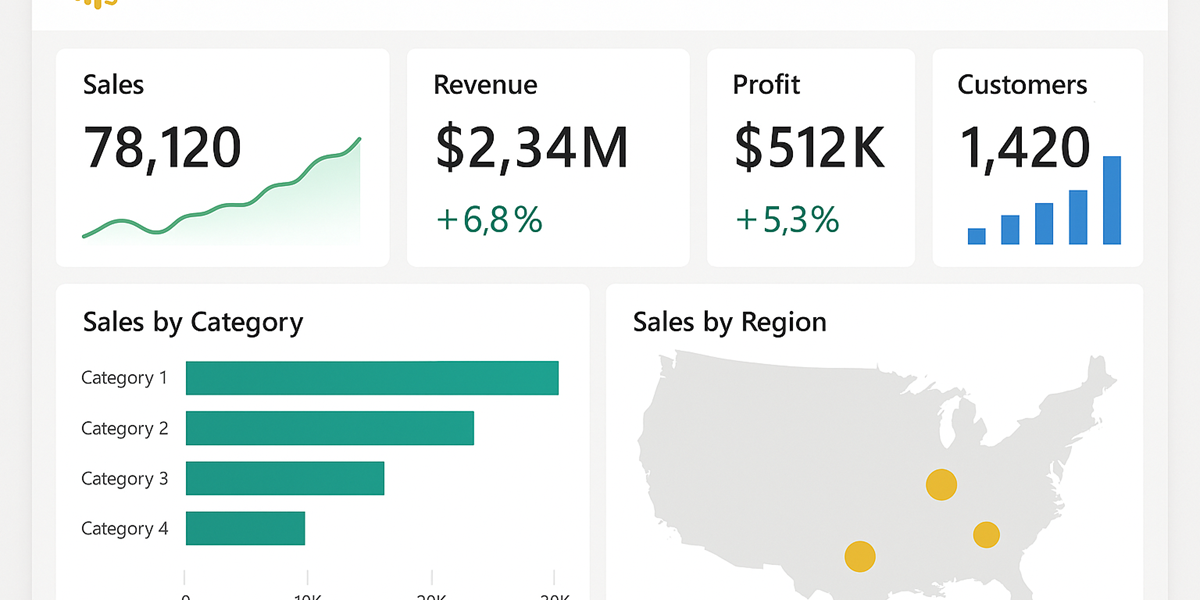
- Visualize data in real-time with interactive dashboards.
- Connect to multiple data sources, including Excel, SQL Server, SharePoint, Dynamics 365, and cloud services.
- Enable self-service analytics, reducing reliance on IT teams.
- Improve decision-making through data-driven insights.
- Scale effortlessly, from small teams to enterprise-wide deployments.
Whether you're tracking sales performance or monitoring operational efficiency, Power BI makes it easy to turn raw data into actionable insights.
5 Essential Power BI Dashboards for Medium-Sized Businesses
Here are five dashboard examples that can deliver immediate value:
1. Sales Performance Dashboard
- Purpose: Track revenue, sales trends, top-performing products, and sales rep performance.
- Data Sources: Dynamics 365 Sales, Excel spreadsheets, CRM systems, SQL databases.
2. Financial Overview Dashboard
- Purpose: Monitor cash flow, profit margins, expenses, and budget vs. actuals.
- Data Sources: Microsoft Dynamics 365 Finance, QuickBooks, Xero, Excel.
3. Customer Insights Dashboard
- Purpose: Understand customer demographics, behaviour, sentiment, satisfaction scores, and churn rates.
- Data Sources: Dynamics 365 Customer Service, survey platforms (e.g., Microsoft Forms), website analytics tools.
4. Operations & Inventory Dashboard
- Purpose: Track inventory levels, supply chain metrics, order fulfilment, and warehouse performance.
- Data Sources: ERP systems, SharePoint lists, SQL Server, Excel.
5. Employee Productivity & HR Dashboard
- Purpose: Monitor employee engagement, training completion, absenteeism, and performance metrics.
- Data Sources: Microsoft Viva Insights, HR systems, SharePoint, Excel.
Getting Started
Let us help you surface your business data, empowering you to make fast decisions with confidence. What does that process look like?
- Identify key metrics and KPIs that drive your business performance and decision-making process.
- Establish where the key data lives and how it can be extracted.
- Build a data model - creating connections and metrics in your data, for an improved intelligent dashboard experience
- Design intuitive dashboards tailored to their business needs.
- Train teams to use and maintain reports.
As a Microsoft Partner, our expertise can guide you through this journey, unlocking the full potential of your data. Get in touch today!